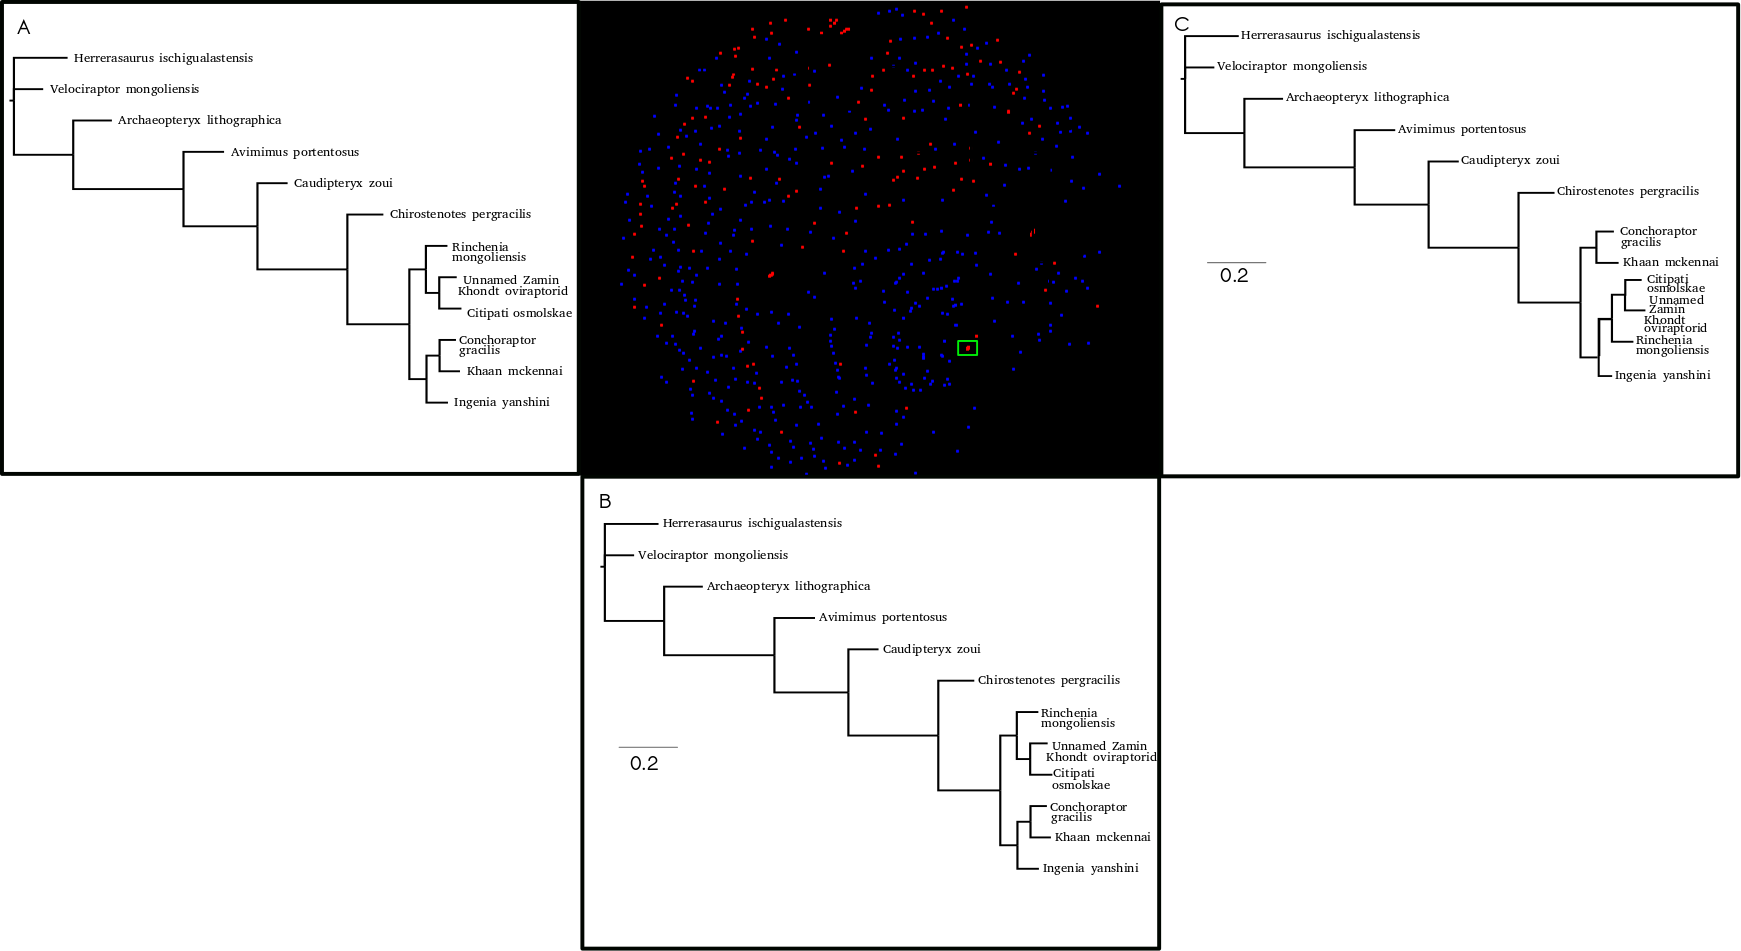
Some of you may be familiar with TreeSetViz. This is a software developed by a team of computer scientists and biologists working in tandem to make it easier to view the treespace explored by an MCMC run. You can read the original paper here. It's a very useful piece of software that has, regrettably, fallen off a bit in terms of maintenance. I recently needed to use it, and decided to put some instructions here because I will forget how I accomplished my work, and for some reason, finding things on the internet is presisantly easier than on my computer or desk.
Task: Overlay the output of two MCMC runs on top of each other, and color points by which run produces them.
First, you need a copy of Mesquite. I am on Ubuntu which, while I love it, has some quirks. So I needed to install Mesquite 2.72.
Second, open Mesquite. If you're on a Mac or Windows, this might be as simple as clicking the Mesquite icon. Ubuntu didn't make an icon. So I navigated into the folder in the terminal, and typed:
./run_mesquite.sh
It will then boot for a little bit. Mesquite has a lot of cool features, and you can see the default modules as it loads.
Once Mesquite has booted, open the File menu. Navigate to Check for Notices/Installs. A dialog box will pop up. In it, enter: http://mesquiteproject.org/packages/tsv/install.xml
to install TreeSetViz. Restart your computer completely.
Once rebooted, reopen Mesquite. You may want to change the amount of memory Mesquite has available to it. To look at 1000 trees, I started Mesquite as:
java -Xmx2500M -Xss4m -Djava.library.path=lib -cp . mesquite.Mesquite
Once Mesquite is open, initialize a new project. I initialized my project with the consensus topology from one of my MCMC runs so I could be sure that I had the correct taxon information. I did this by chooing File > Open New File and navigating to my tree.
Now, you can add your tree samples. If you've correctly opened a file, you should now have a Project Window. From the Project Window, you can do all kinds of tree-based operations. Under Taxa&Trees, choose Make New Trees Block From > Sample Trees From Separate Nexus File. Choose you nexus file. It will count all the trees for a minute, then ask how many you'd like to load. I used 500. It will then ask if any trees should be skipped; I skipped the burnin period.
Repeat this for your second sample.
Now is where things get a little tricky. Under Taxa&Trees, choose TreeSetVisualization. A window will pop up asking which trees to use. Choose Concatenate Trees from Two Sources. Select your first block of trees and click OK. Then do the same for the second. TSV will now ask you for some TSV-specific info about consensus trees and between-tree metrics. Choose whichever makes sense for your data. I used a majority-rule consensus tree and Robinson-Foulds as teh between tree metric.
TSV will now calculate the metrics between trees. This will take a minute.
Once everything is loaded in, click 'Start MDS' to run the scaling described in the Hillis paper. Now you have a set of trees, all of which are scaled uniformly. But you want to see which run is which!
So, under Visualization, click Color Points By. This is what lost me for a while: you want the Attached Value option. It colors by which tree source each tree comes from.
That's it! Easy!

